Tutorial
pn-diode example
Now that you’ve installed Simudo, you can perform the most basic of simulations. Namely, getting a J(V) curve for a diode (pn-junction).
Download the pn-diode example, then run:
python3 pn_diode.py run
This will run the simulation, a voltage sweep from 0V to 1V. It should
take 2-4 minutes, and it will produce a series of files containing
spatial data (e.g.,
output V_stepper_parameter=0.00000.csv.0), and a CSV file
containing summary data (output V_stepper_parameter.csv).
You can produce a plot of total current as a function of applied voltage:
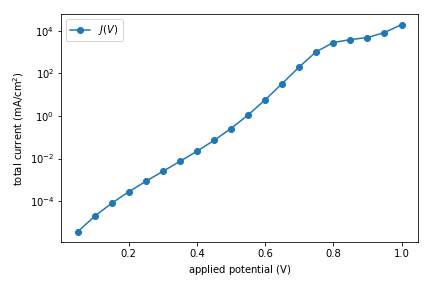
using the following code:
import pandas as pd
import matplotlib
from matplotlib import pyplot as plt

if __name__ == '__main__':
    df = pd.read_csv("output V_stepper_parameter.csv", skiprows=[1])
    df['V'] = df['sweep_parameter:parameter']
    df['J'] = df['avg:current_CB:p_contact'] + df['avg:current_VB:p_contact']
    df = df[df['V'] != 0]

    fig, ax = plt.subplots()
    ax.plot(df['V'], df['J'], label="$J(V)$", marker='o')
    ax.set_yscale('log')
    ax.set_xlabel(r'applied potential ($\mathrm{V}$)')
    ax.set_ylabel(r'total current ($\mathrm{mA}/\mathrm{cm}^2$)')
    ax.legend()
    fig.tight_layout()
    fig.savefig("tutorial-pn-diode-JV.png")
fourlayer example
Now let’s try an example that contains an intermediate band, using the fourlayer helper. fourlayer.py contains useful helper methods to set up and run
Simudo simulations for 1D devices with four layers: front-surface field (FSF),
p-type semiconductor, IB region, n-type semiconductor. The purpose of this example
is to provide a model that you can modify for your own purposes.
The most useful method in fourlayer.py is run, which takes in a yaml file containing
a dict of parameters and runs Simudo as requested in that file. You can set up a
submitfile using fourlayer.multiplex_setup.
Look at fourlayer_example for an example of using fourlayer. It is not chosen to be a particularly good IBSC!
You can move fourlayer_example to a location of your choosing and then run:
python3 -u fourlayer_example.py | tee -a out.txt
You will see a lot of screen output as the desired problem is set up and first the optical
intensity and then the voltage ramp to the desired values. It will run for 20-25 minutes,
and a number of output files will be produced in
test/, including yaml files with integrated quantities at each desired voltage and csv files
with spatially varying quantities on a line cut through the centre of the device.
The sample simulation should give an efficiency of 34.1%.
Note that most of the output that you saw in the pn-diode example is not sent to the screen. You can see more details in the info.log and debug.log files.
The methods in sweep_extraction are helpful for gathering the output from
fourlayer_example and making a variety of plots. The example comes configured to run
a single Simudo calculation and output both a JV curve and a band diagram at short circuit, which should appear as png files.
There are several helpful features in fourlayer_example, which you can find
in that file. For example, you can modify it to find the value of IB_thickness that optimizes device efficiency by setting params['optimize_key'] = 'IB_thickness'. Please contact us if you have any questions.